Course Research at MSU
Literature Review
For this research, I examined the decline of North American bird populations since 1970, a loss now quantified at over 3 billion individuals. Working through a positivist geographic framework, I synthesized peer-reviewed research to identify and evaluate the measurable drivers behind this trend, including agricultural intensification, food web disruption, migratory habitat loss, direct anthropogenic mortality, and climate change.
The review found that rarely can this scale of loss be attributed to a single cause. Instead, these drivers compound across spatial and temporal scales, each measurably worsening the others. Agricultural intensification emerged as one of the most direct and quantifiable forces, while climate change functions less as a standalone driver and more as an amplifier of everything else. The review concludes that reversing bird decline will require policy responses that treat these interconnected systems as a whole rather than as separate environmental concerns.
Geomorphology - Landscape Analysis
A Hillslope Stability Analysis of the Yellowstone Club
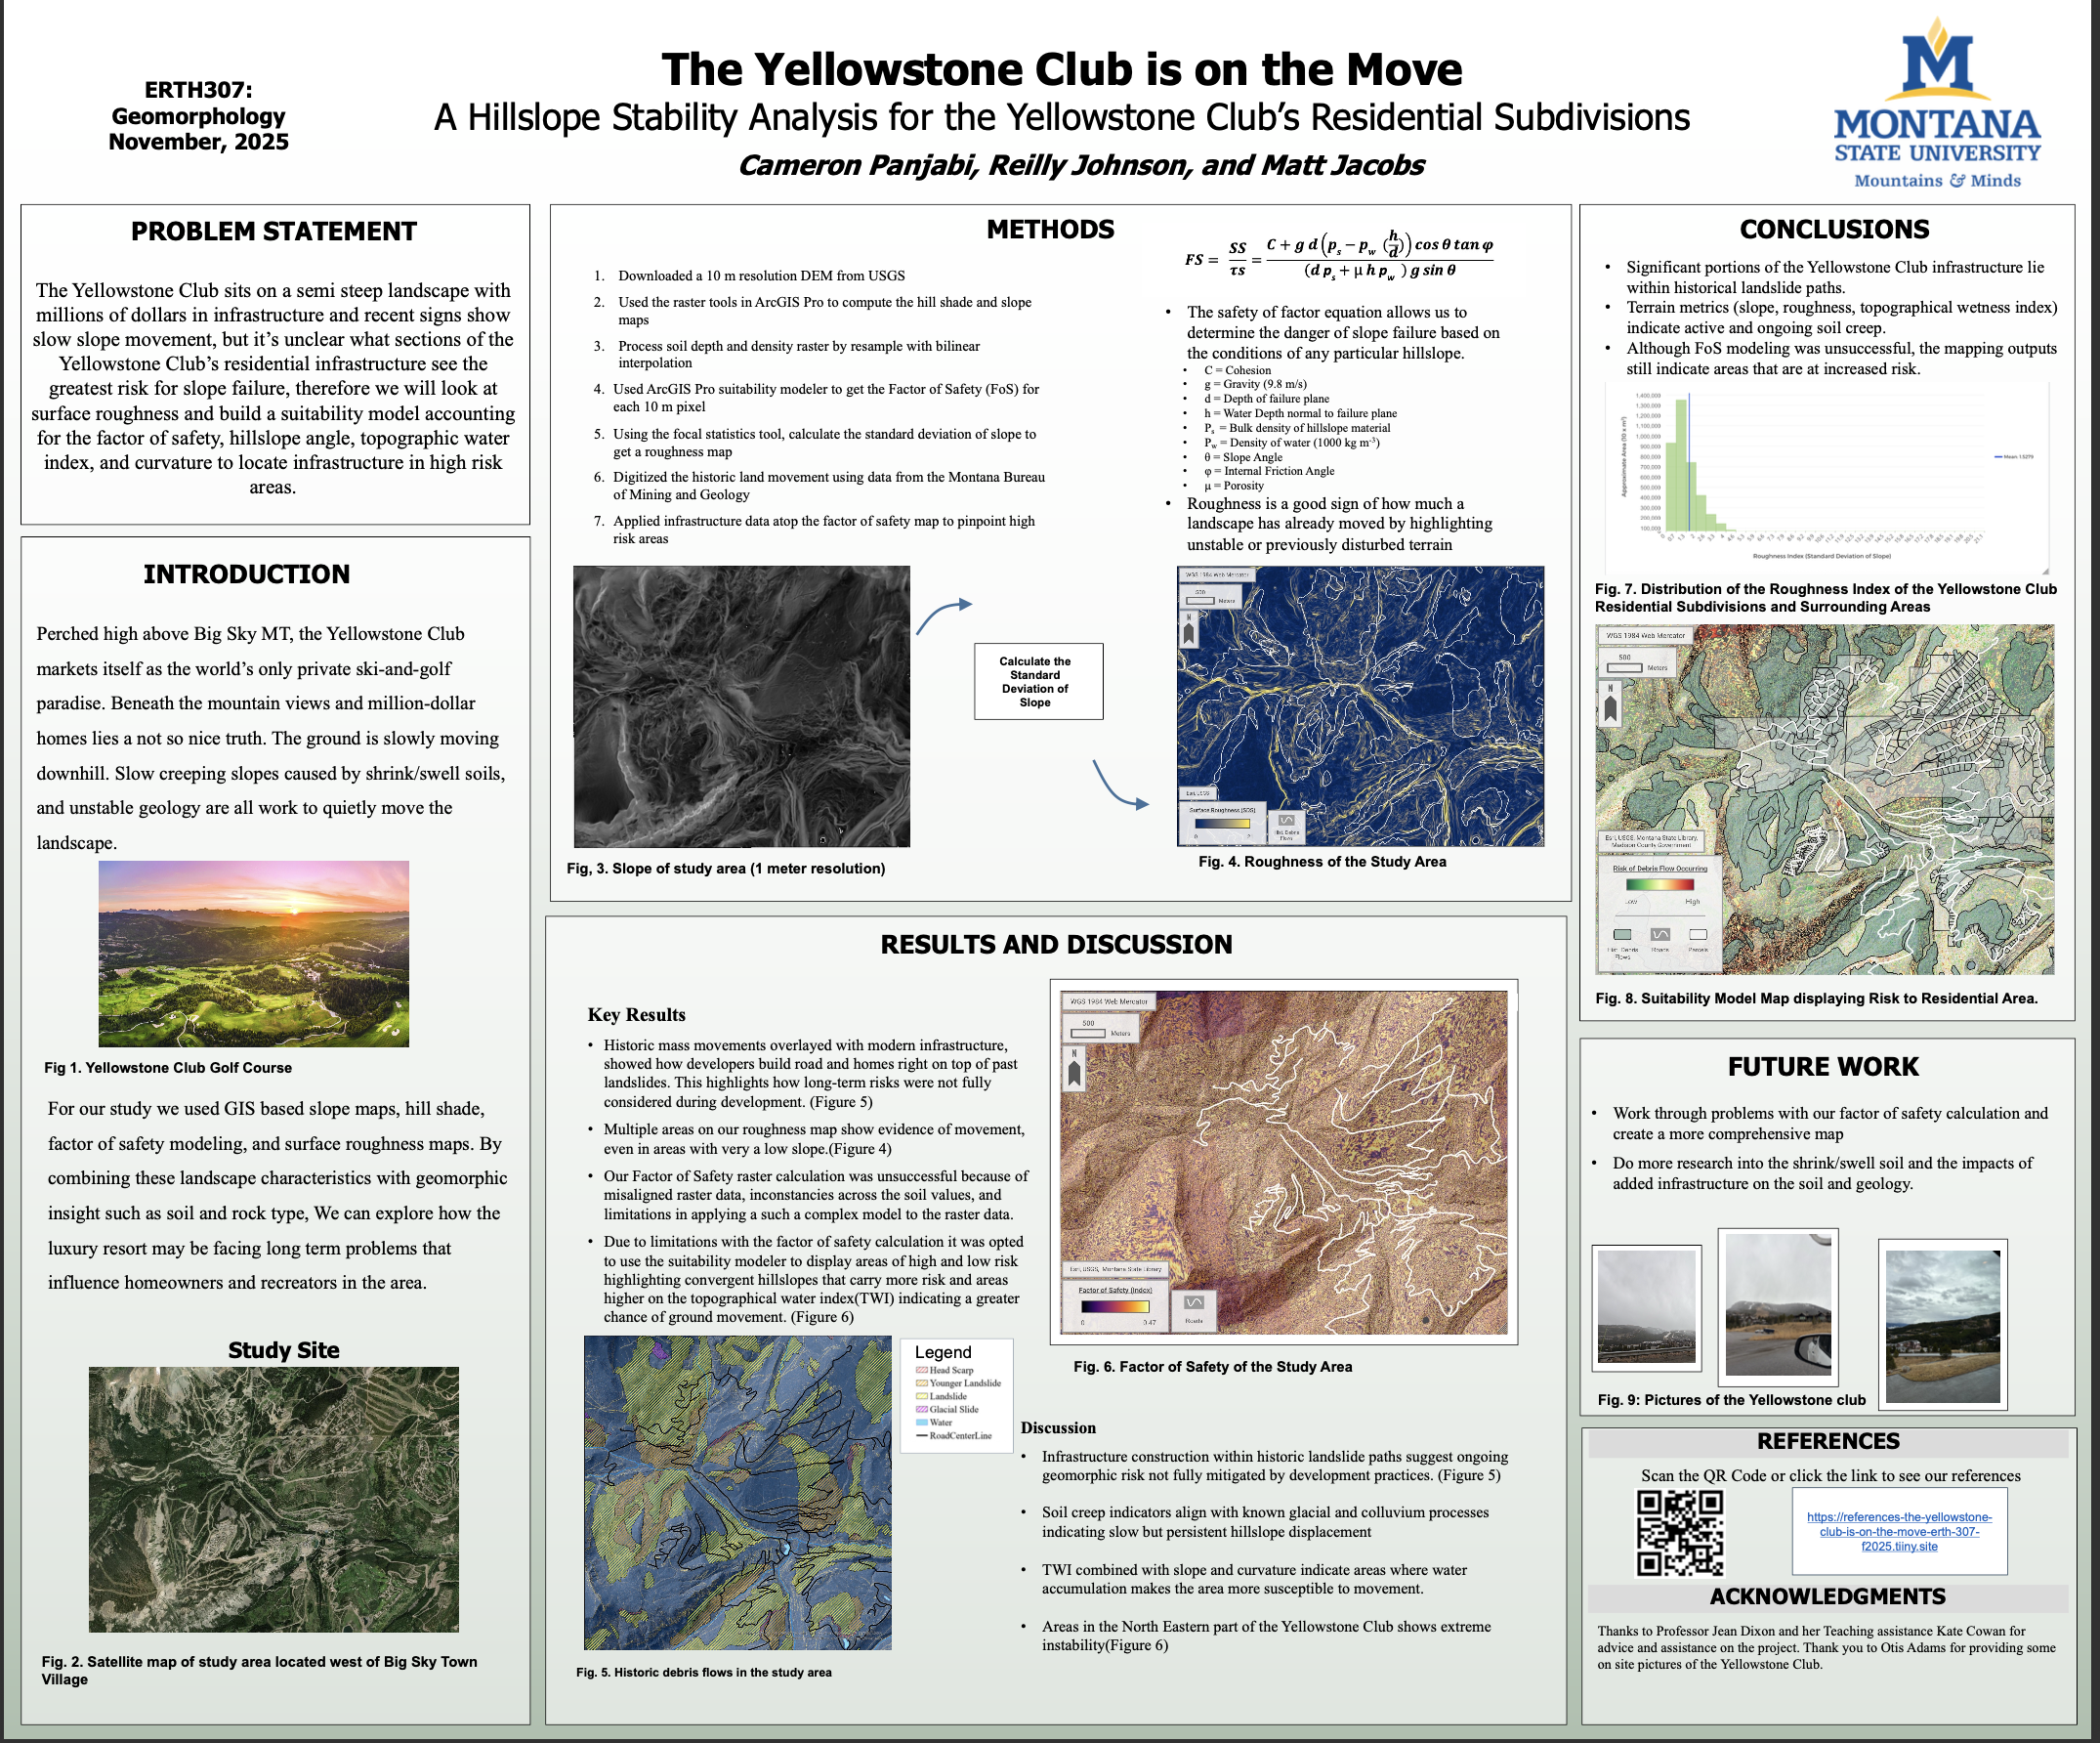
For this project, my team and I investigated hillslope stability at the Yellowstone Club, a private ski and golf resort in Big Sky, Montana. Using a 10-meter resolution digital elevation model from the USGS, we built a series of GIS-based terrain analysis maps in ArcGIS Pro, including slope, hillshade, surface roughness, and topographic wetness index (TWI). We then overlaid historical landslide and debris flow data from the Montana Bureau of Mining and Geology to see exactly where past mass movements had occurred relative to the resort's current roads and homes.
Our analysis revealed that significant portions of the Yellowstone Club's infrastructure sit directly on top of historical landslide paths, meaning long-term risk wasn't fully accounted for during development. Terrain indicators like high surface roughness and elevated TWI values point to areas of active soil creep and water accumulation, particularly in the northeastern section of the property. While our Factor of Safety model ran into technical limitations with raster alignment, our suitability model successfully highlighted the highest-risk zones, painting a clear picture of a landscape that is slowly on the move.
Energy Development in Montana
As part of a collaborative geography and GIS course project, my class built an interactive map documenting the full landscape of renewable energy development across southeastern Montana. The map brings together wind farms, solar fields, hydropower facilities, and fossil fuels into a single, explorable interface. This gives users a bird's-eye view of how the region is being shaped by the ongoing energy transition.
A Complete Analysis of The Yellowtail Dam and Afterbay Project
In this research, I looked into the Yellowtail Dam and Afterbay on the Bighorn River. This was a massive federal water project built on the Crow Tribe's (Apsáalooke Nation) reservation in the 1960s. I explored the dam's role as a 250-megawatt hydropower facility, its benefits for flood control, irrigation, and world-class trout fishing, and the deep tensions surrounding who actually profits from those benefits.
Drawing from academic sources, federal agency reports, and original interviews with tribal community members and project leaders, I examined how decades of federal negotiation left the Crow Tribe with little compensation from a river they legally own.
A central focus of the paper is the Crow Tribe's ongoing effort to build their own small hydropower facility at the lower Afterbay. This would be a tribally led project that would finally keep energy revenue on the reservation, create stable local jobs, and give the community direct control over a resource that has generated wealth for outsiders for over 60 years. The project represents far more than infrastructure, but a push toward economic self-sufficiency and a meaningful step away from federal dependency for a community that has been on the losing end of this river's story for generations.
Advanced GIS & Remote Sensing
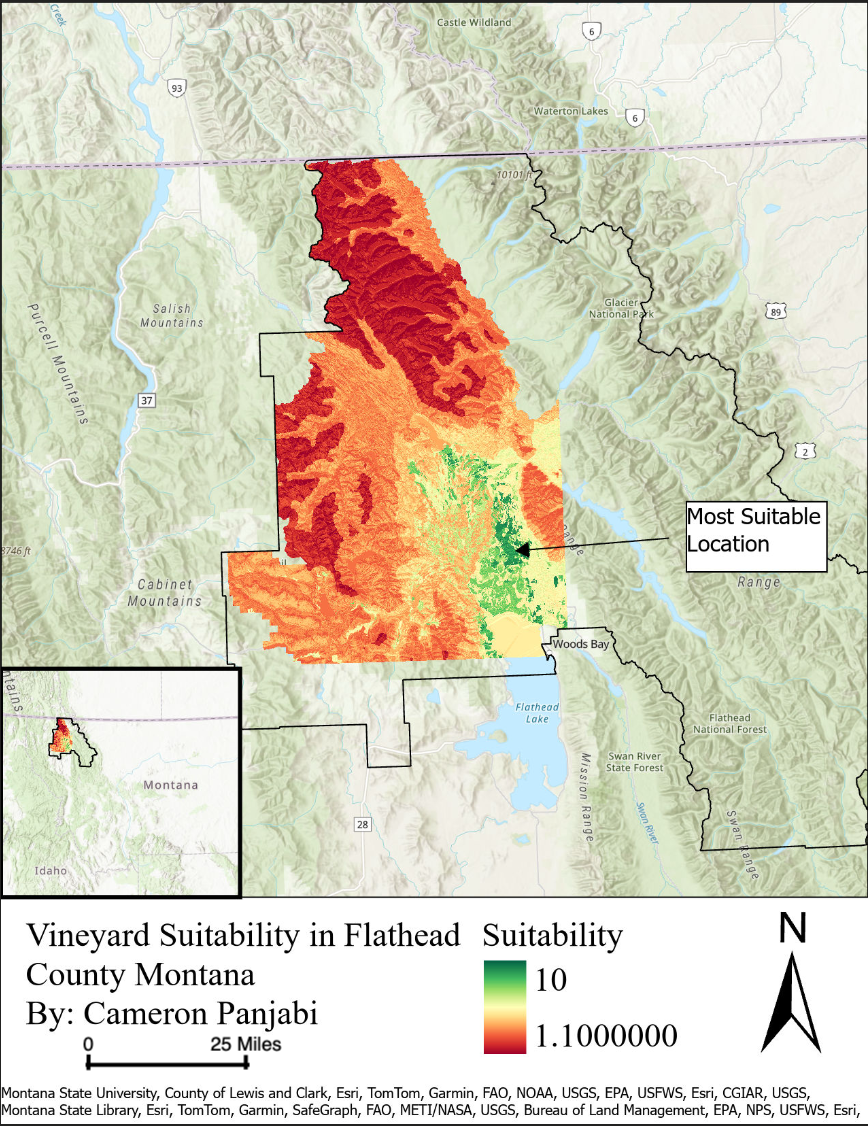
Vineyard Suitability in Flathead County, Montana
For this project, I used ArcGIS Pro's Suitability Modeler to identify the best possible locations for vineyard development northwest of Flathead Lake in Flathead County, Montana. Starting with a 10-meter digital elevation model downloaded from the USGS, I derived slope and aspect rasters to capture how terrain shape and sun exposure vary across the landscape. I then combined those with soil classification data from the NRCS and frost-free day climate data from the Montana State Library to build a comprehensive picture of where grapes could realistically grow in northwestern Montana.
Using a weighted overlay approach scaled from 1 to 10, I transformed each variable into a common suitability index. I tested two weighting schemes: one prioritizing topography and the other emphasizing soil type and temperature. The result was a detailed suitability map pinpointing a cluster of highly suitable land near Woods Bay where southern-facing slopes, favorable soils, and a longer frost-free season all converge. The project was a hands-on introduction to how GIS-based suitability modeling can turn raw environmental data into real, site-specific decisions.
Change in Invasive Plants
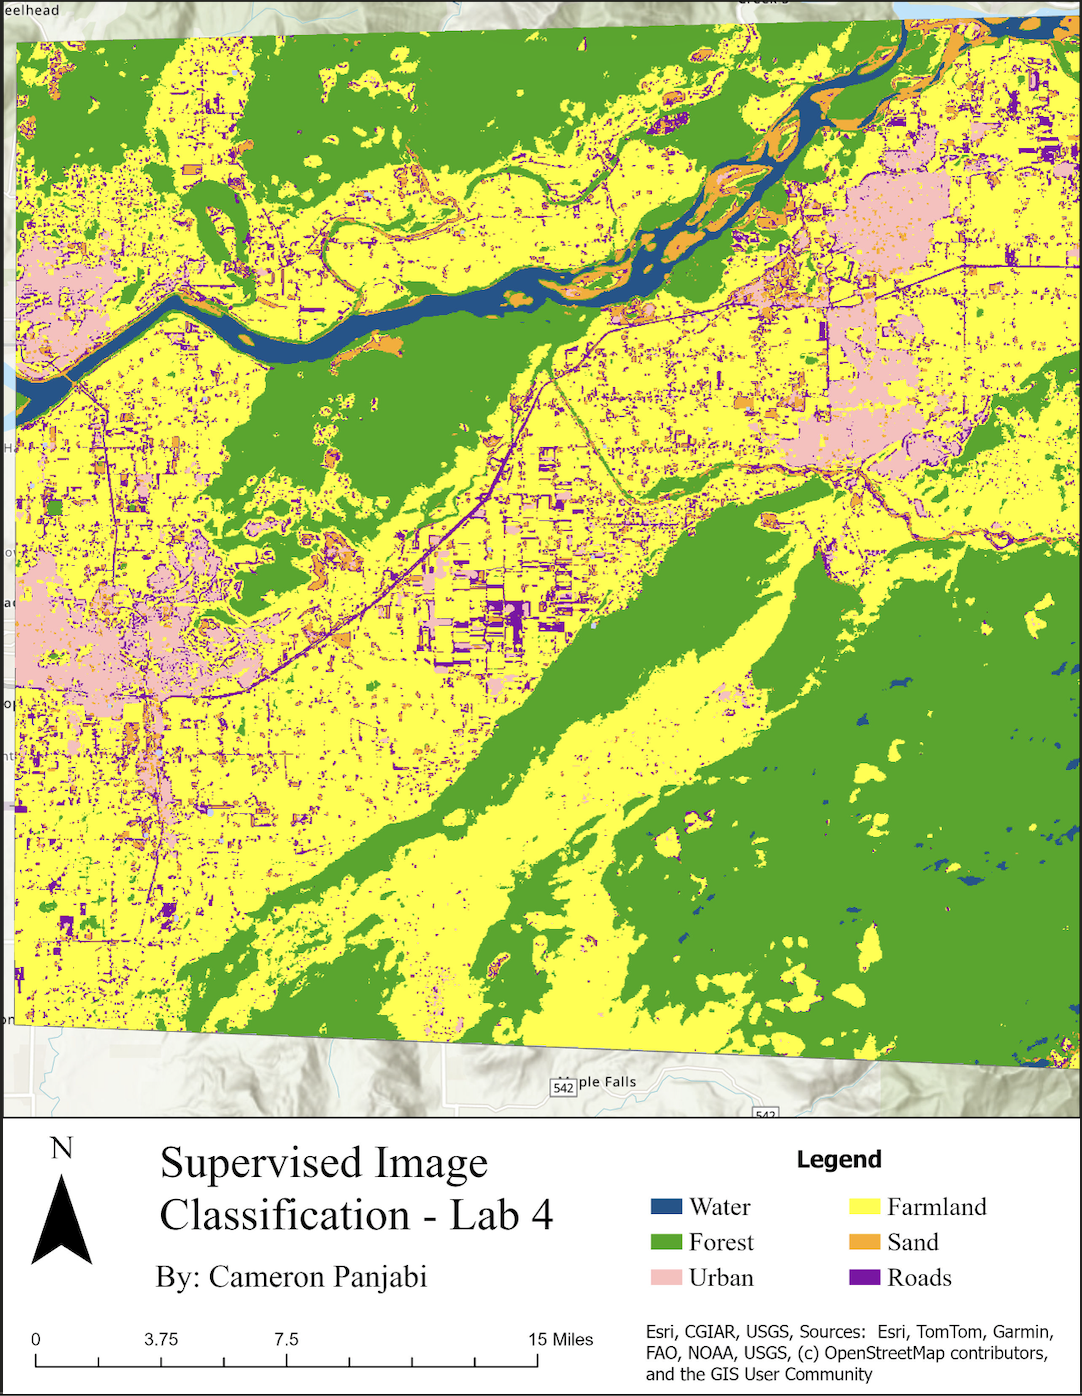
For this project, I used the Rangeland Analysis Platform (RAP) and ArcGIS Pro to perform a change detection analysis on invasive annual grass cover at the Red Bluff Research Ranch in Montana. RAP is a remote sensing product built from 30-meter Landsat imagery and validated against Bureau of Land Management field plot data, making it a powerful tool for monitoring vegetation change across rangelands over time. By downloading multi-temporal raster data from RAP and clipping it to the study area, I was able to track how invasive annual grass cover shifted across the landscape between time periods.
Using ArcGIS Pro's change detection wizard, I classified areas of large decrease, small decrease, small increase, and large increase in invasive grass cover, revealing that the most significant spread was concentrated in the southern portion of the ranch. A time series analysis also showed that by 2021, invasive annual grasses had reached roughly 42% cover compared to just 10% for native perennial forbs and grasses, a stark illustration of how aggressively invasive species can take hold on western rangelands. The project gave me hands-on experience with a real rangeland monitoring workflow that land managers and conservation organizations use to track and respond to invasive species pressure.
Bridger Wildfire Analysis
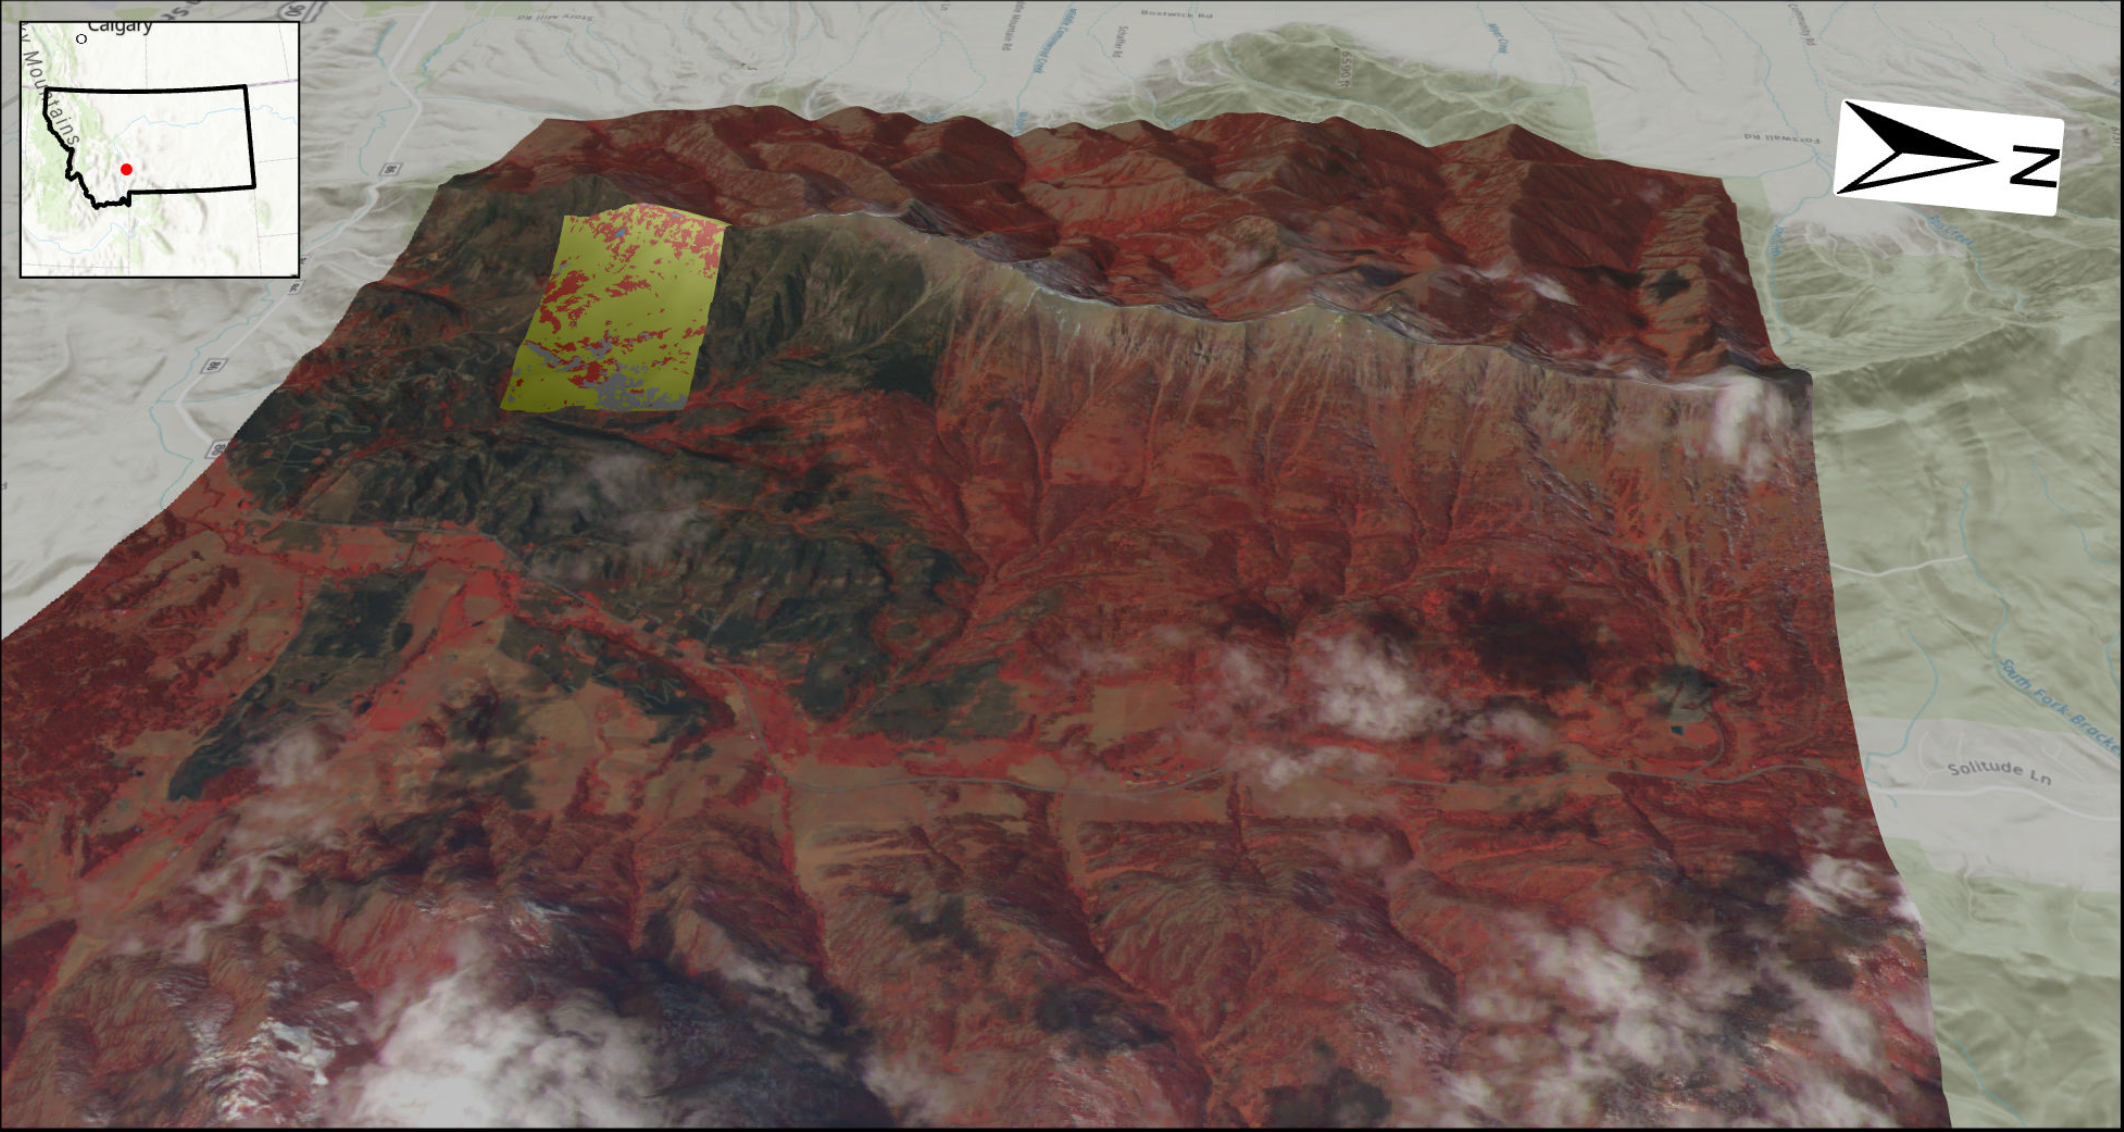
In this project, I analyzed the impact of the Bridger Mountain fire using GIS techniques. I worked with high-resolution multi-band satellite imagery to classify burned and unburned vegetation, resampled raster data for spatial alignment, and created a final 3D oblique map for visualization. Using ArcGIS Pro, I processed and analyzed spectral data to distinguish land cover classes, extracted focus areas using mask and resampling tools, and generated statistical summaries to improve data visualization, such as bar plots and histograms. Finally, I compiled my findings into a professional 3D map layout, incorporating essential cartographic elements and a short interpretation of the results.
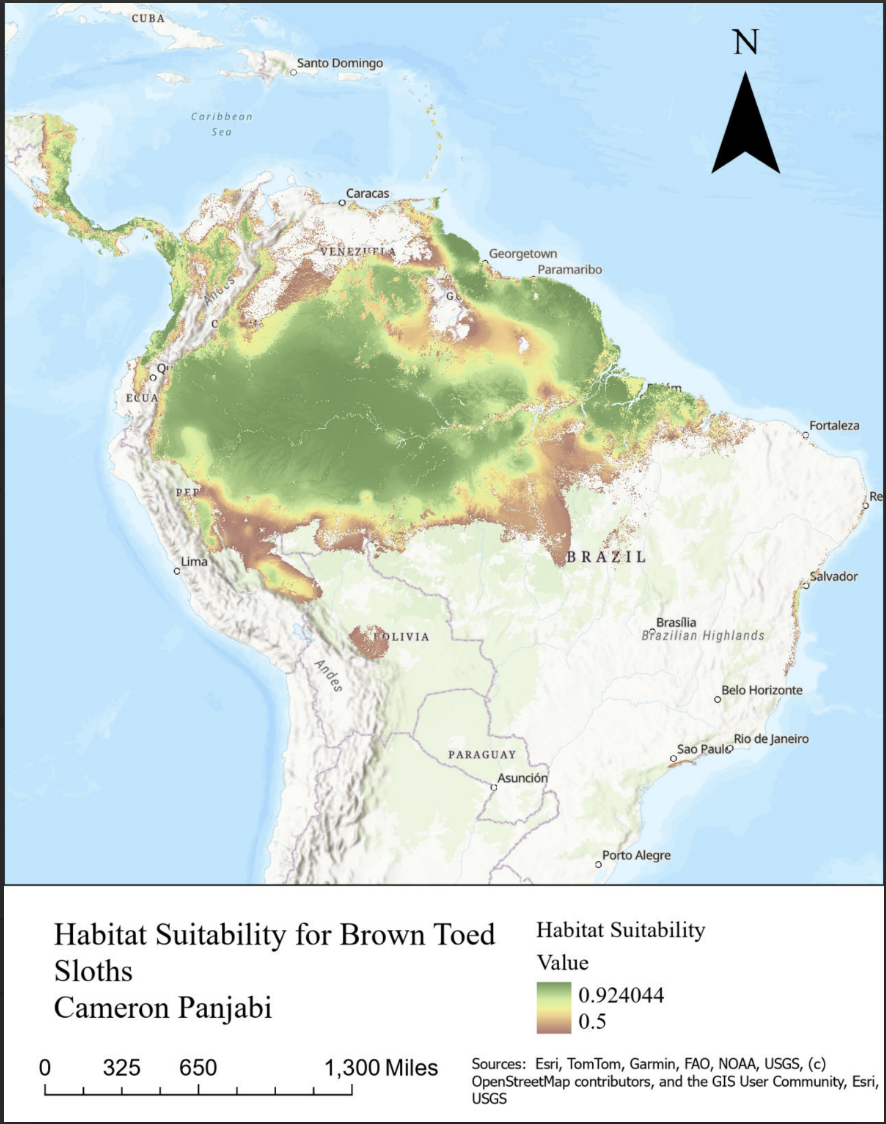
Habitat Suitability Modeling for Brown-Throated Three-Toed Sloths
What is an ecological niche? An ecological niche is the full set of environmental conditions (temperature, precipitation, food, competitors, etc.) that a species needs to survive and reproduce. It defines both where a species can live and what role it plays in that ecosystem.
What is a species distribution model? An SDM is a statistical model that uses known species occurrence records and environmental variables to predict where suitable habitat exists across a landscape, producing a map of habitat suitability or predicted presence/absence.
Target Species — Bradypus variegatus (Brown-throated Three-toed Sloth): This species occupies tropical and subtropical forests from Central America through northern South America. Its niche is defined by warm, stable temperatures year-round, high annual rainfall, and dense forest canopy, which it depends on almost entirely for food (leaves) and shelter. It is highly sensitive to cold, deforestation, and habitat fragmentation.
What are the variables in the Predictor model? Temperature Seasonality, Max Temperature of Warmest Month, Min Temperature of Coldest Month, Annual Precipitation, Elevation, Percent Tree Cover
How do these variables relate to our target species distribution and life history? Sloths cannot tolerate cold, so temperature extremes define their range. They need stable year-round warmth, so low seasonality climates are ideal. High rainfall supports the tropical forests they depend on; they are lowland animals, so elevation limits them to warmer areas. As obligate canopy dwellers, high tree cover is essential for food and movement.
What type of model was used? Random Forest — a machine learning ensemble method that builds 500 decision trees on random data subsets and averages their outputs. It was run 10 times with different random seeds, and the results were averaged to improve stability.
Other variables not in the model that affect habitat suitability:
Forest fragmentation - isolated forest patches may be climatically suitable but unreachable due to dispersal barriers. Anthropogenic disturbance - roads, hunting, and power lines cause mortality not reflected in climate or tree cover data. Tree species - sloths are selective feeders; two areas with equal tree cover may differ greatly in food availability. Predation - harpy eagles and large cats suppress populations in ways unrelated to environmental gradients.
Supervised Image Classification
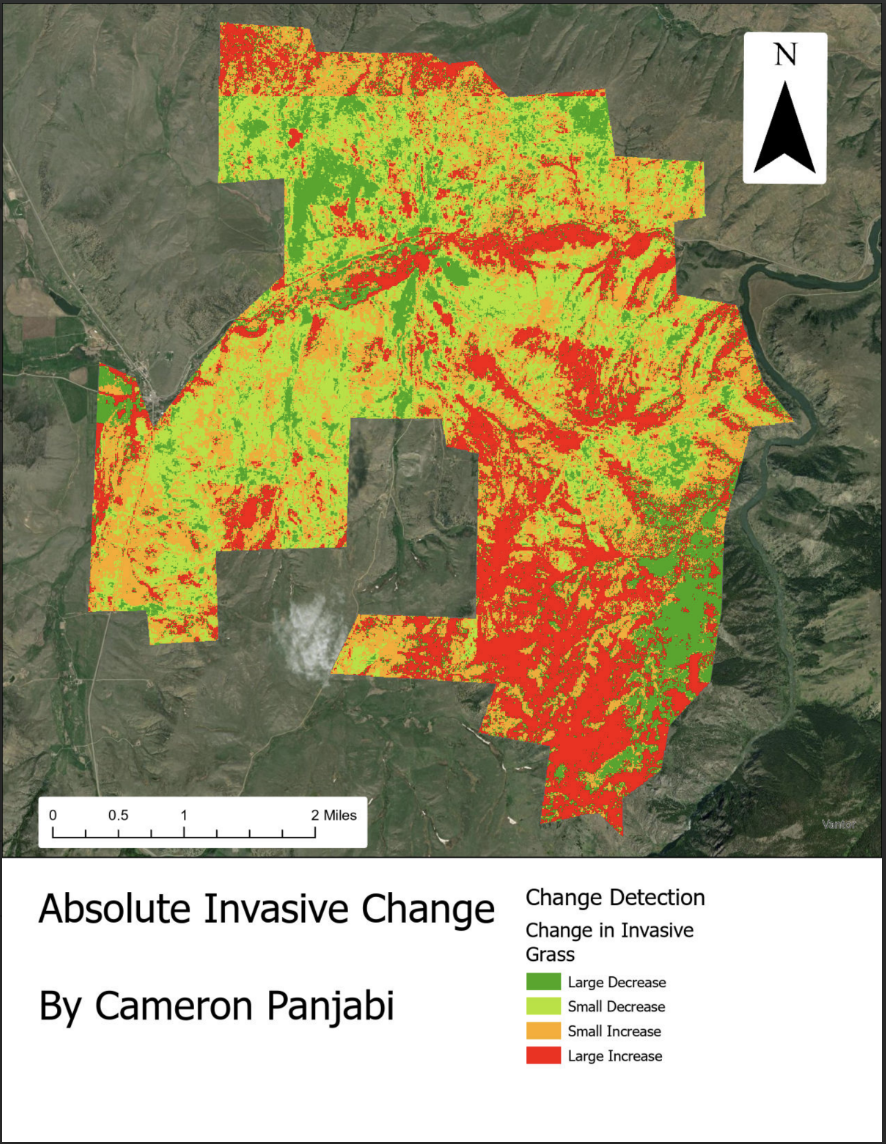
For this project, I used supervised image classification techniques in ArcGIS Pro to classify multispectral satellite imagery of the Bellingham and Skagit Valley area in northwestern Washington into six distinct land cover categories. Working with high-resolution imagery, I manually created training samples for each class: Water, Forest, Urban, Farmland, Sand, and Roads, teaching the classification algorithm to recognize the unique spectral signature of each land cover type across the scene.
The resulting map reveals the striking patchwork of this region, where wide ribbons of the Nooksack River wind through a valley floor dominated by bright yellow farmland, broken up by dense forest patches, scattered urban development, and sandy river deposits along the channel margins. The project built my understanding of how different land surfaces reflect light differently across the electromagnetic spectrum, and how those spectral differences can be used to map and monitor landscapes at a regional scale.
GPS Mapping of Urban Skiing in Bozeman
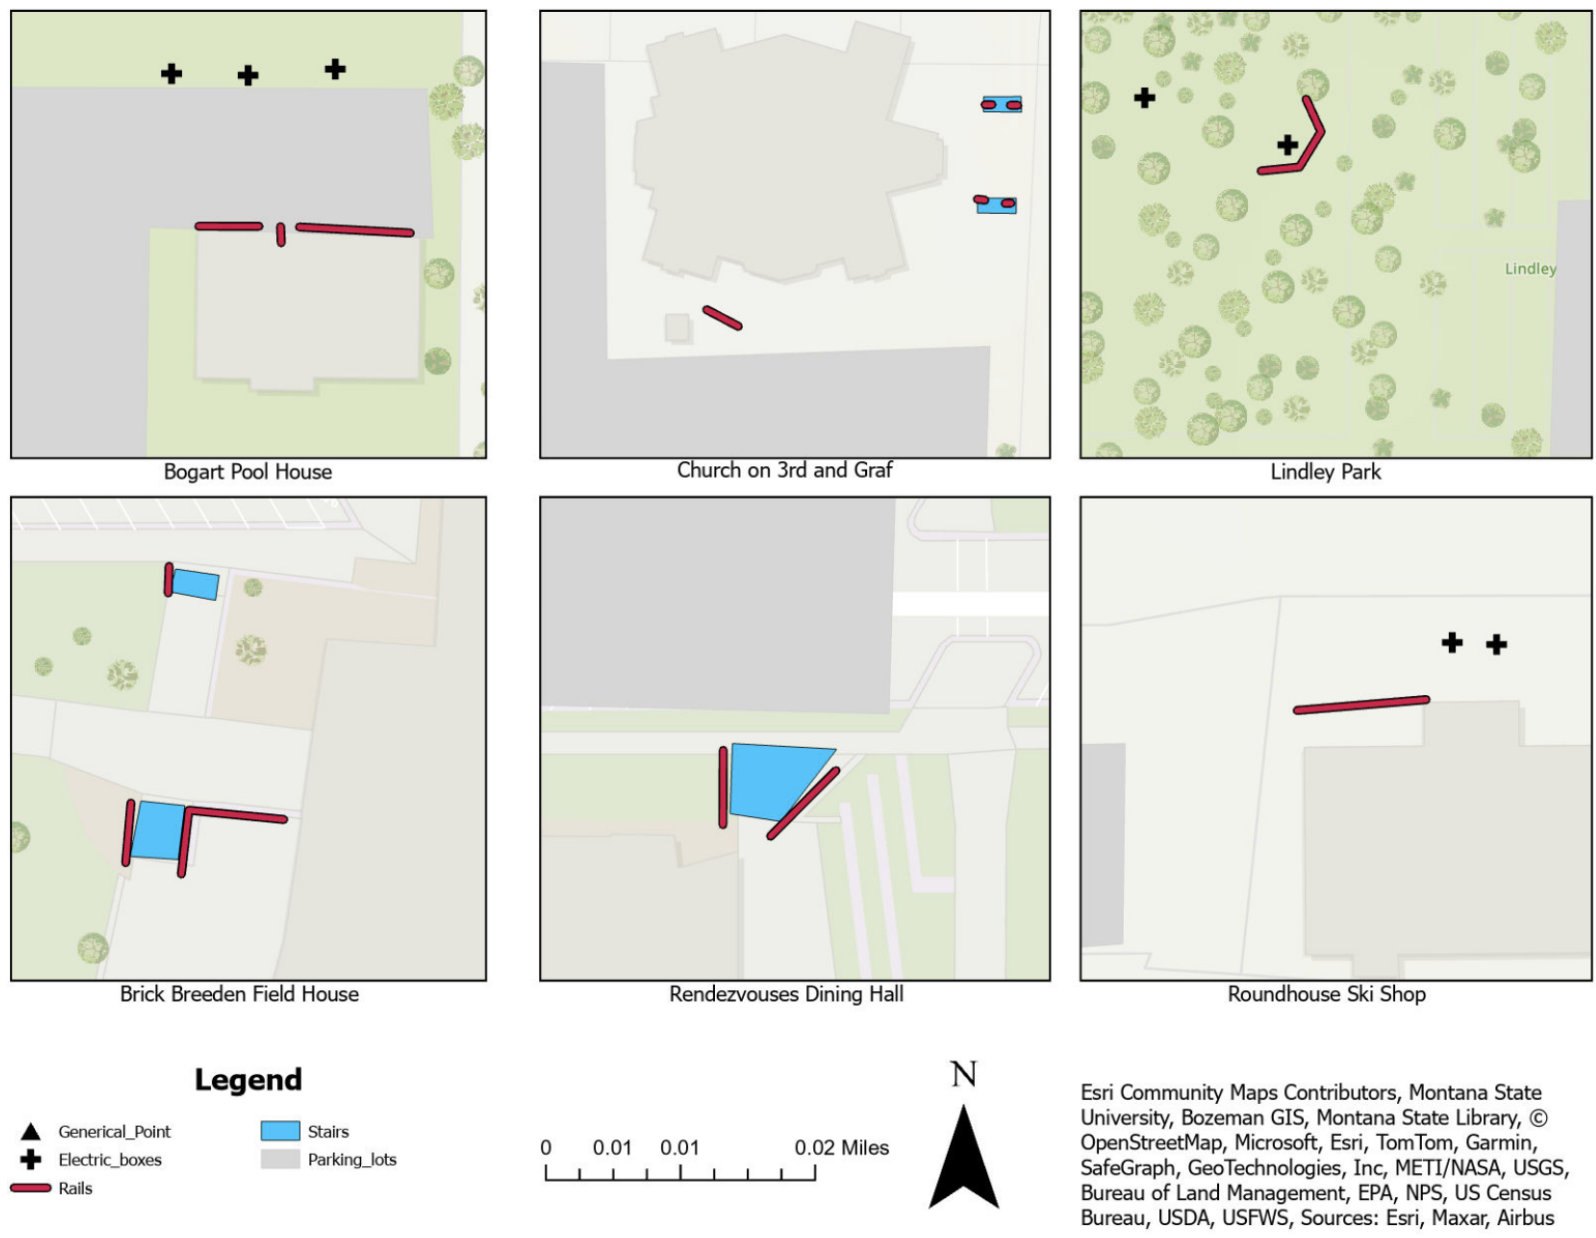
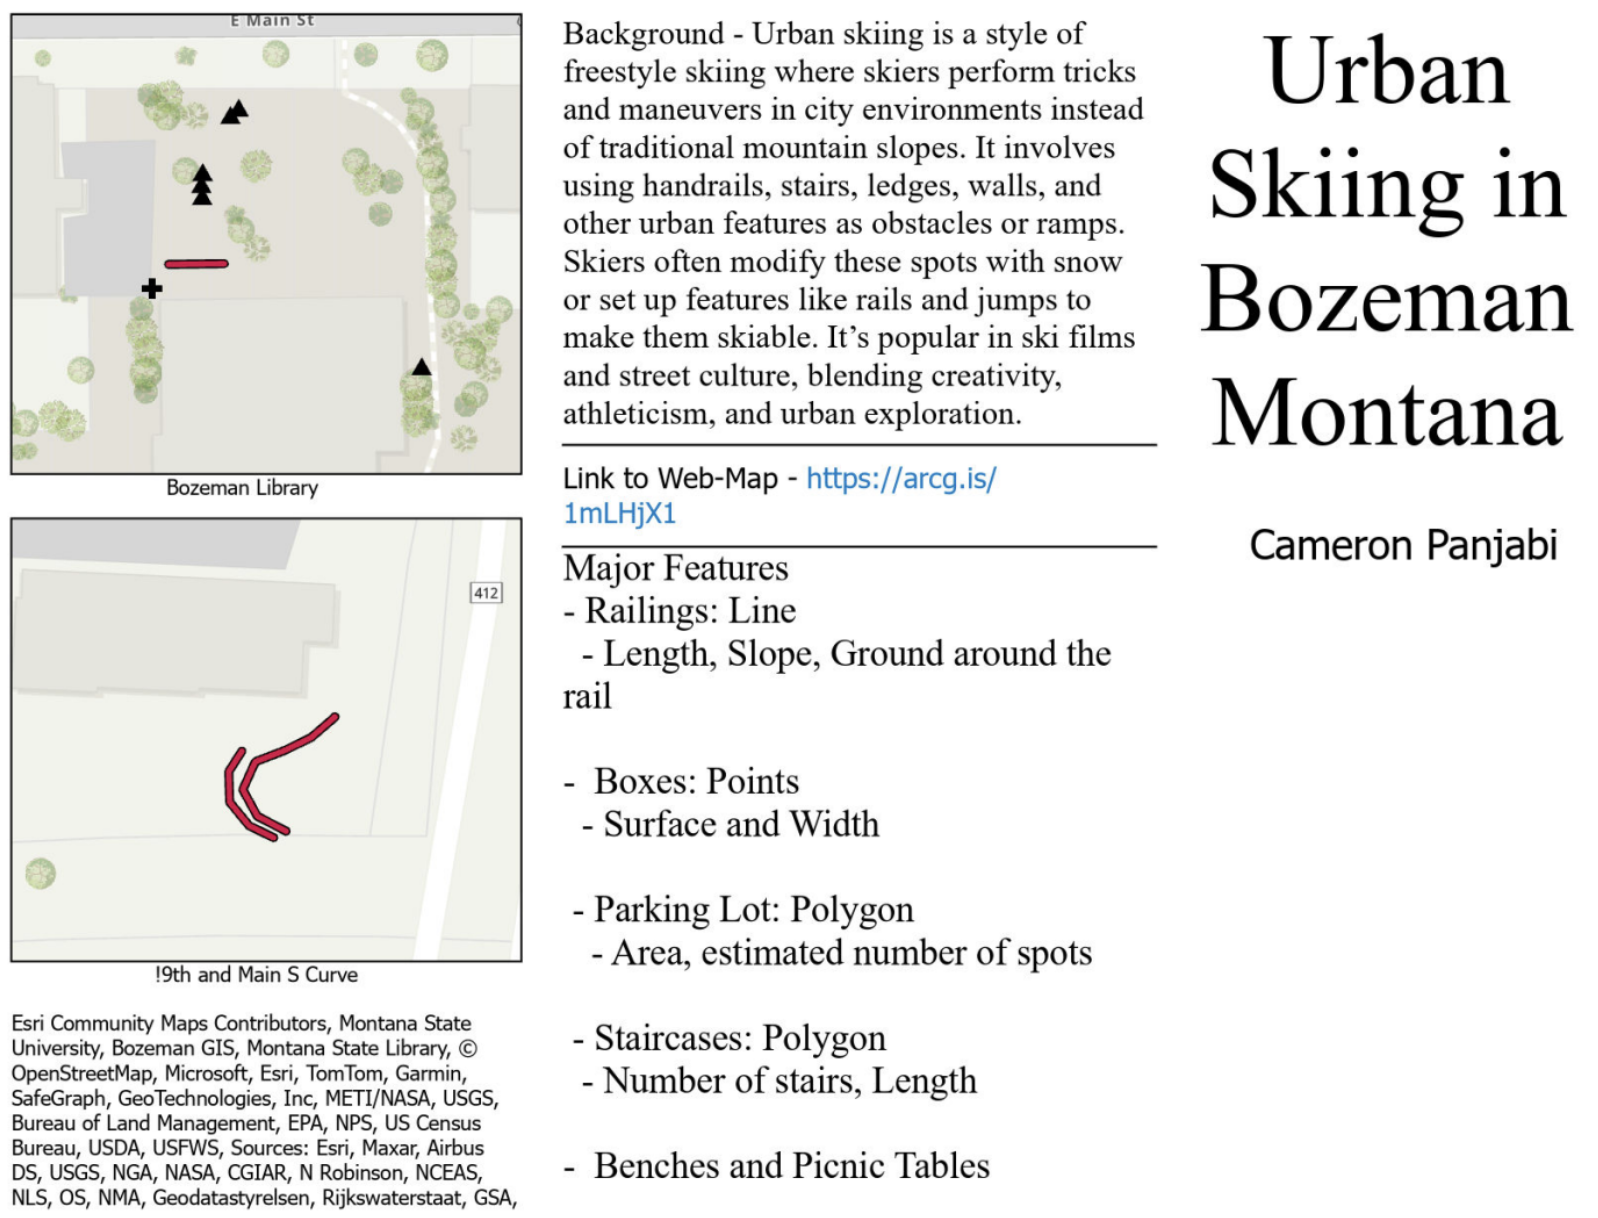
Tri-fold Panflet for People interested in Urban Skiing
GVLT Trail History Mapping
Coming soon….